Publications
POLICY Analysis
Looking at How, Not Just How Much
November 23, 2010
By Lisa Shapiro for BusinessNH magazine
As the next New Hampshire Legislature works to enact a new budget for the upcoming biennium, it faces an estimated budget gap of $500 million to $800 million. Much of the discussion naturally centers on budget priorities: How much money should we spend, and on what. Equally important — but less transparent — is how money comes in and how it is distributed.
For better or worse, government is a significant part of NH’s economy. Government spending (federal, state and local combined) represents about 10 percent of NH’s gross state product. There are nearly 100,000 government jobs in the Granite State, approaching 15 percent of total employment.
Some government programs have easy-to-see funding and spending streams. But many have significant federal, state and local tie-ins, both in the source of their funding and how they are implemented. For example, nearly 50 percent of the NH Department of Health and Human Services budget comes from the federal government, or more than $1 billion a year in the current biennium, and almost one-third of the total state budget has federal origins, or more than $3.5 billion in the current two-year budget.
Likewise, by some measures, local governments in NH collectively receive more than $1 billion annually from the state-mostly for education funding, but also for environmental programs, highways, general municipal revenue sharing and other items. For all those reasons, understanding the sources of budgetary items is crucial to setting spending priorities.
True Budgetary Impacts
While budgets mostly bring to mind dollar amounts, in many cases those amounts are tied to specific program objectives, matching funds and other stipulations that make the numbers much less black and white than they seem.
For example, federal dollars often come with not only a requirement for matching dollars, but a myriad of strings on how total dollars can be spent and even how matching dollars can be raised. Similarly, state-local sharing formulas are often tied to specific embedded overall program approaches and objectives.
When one of the components within these formulas and policies change, or funding from one or all the sources is reduced, it may cause inefficient or unintended results, such as the loss of additional funding.
Behind the Numbers
Health care, energy and the pension system are three areas that highlight the complicated tie-ins that come with federal and state dollars. For example, Washington has a program designed to subsidize the cost of health care for indigents. The money shows up on NH’s budget as a $1 billion revenue stream to the general fund over the past 10 years. But during that decade, the way the federal government allows the money to be distributed, and the way the state implemented one of its health care taxes, The Medicaid Enhancement Tax, has changed. Those two things, combined with future cuts in federal funding, mean the state might want to review and redesign how those funds are raised and distributed-or risk shifting the burden of raising that money onto businesses and by extension NH residents.
Another example is in the energy arena. The Granite State’s government raises money for clean energy through, among other sources, a regional cap-and-trade program, a state portfolio requirement and federal stimulus allocations. In 2010, the Legislature spent months
deliberating how to allocate funds to create clean energy. Meanwhile, some money was being distributed under rules not adjusted for current market conditions, and other funds idled as new bureaucracies were constructed. For instance, subsidies for residential solar and wind projects were set higher than needed, with $2.7 million paid out before regulators reduced the subsidy by 58 percent. And a federal audit issued in August reported that just 12 percent of one of the buckets of energy stimulus dollars sent to the Granite State was actually spent. For more efficient planning and outcomes, it might pay to consider other funding mechanisms and rules.
Then there is the pension system-the state’s piggy bank in bad times. In order to balance its budget, the State recently lowered its share of certain pension contributions to cities and towns, from 35 percent to 30 percent, and then to 25 percent, thus shifting $27 million in pension costs from the state to local governments in the current biennium. If done again in the upcoming two-year cycle, the state-to-local pension shift may be another $80 million. Although the whole matter is now in the courts to determine if the shift is legal, it would seem time to rethink the sharing arrangements going forward.
No matter how well budgets are constructed at the outset, the policy examples listed above demonstrate how budget items can quickly become dated. The need to constrain budgets and grow the economy demands lawmakers look not only at the amount spent, but also at how programs are organized and implemented.
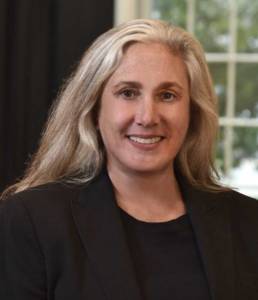
Lisa Shapiro, Ph.D. is chief economist with Gallagher, Callahan & Gartrell in Concord, NH. She analyzes economic and industry trends, and works with businesses on strategic and economic issues and legislative and regulatory matters.
